


Photo by Greg Bulla on Unsplash
Google Data Analyst Course Summary
What I've learned from Google Data Analyst Course Chapter 1 - 3


This is just my personal summary from Google Data Analyst Certificate Course chapter 1 through 3.
Chapter 1 - Foundation of Data Analyst
In this chapter I've learned about Data Analyst Process which is break down into 6 steps:
- Ask
- Prepare
- Process
- Analyze
- Share
- Act
How Data became Insights, the Benefits and the Data Ecosystem Roles
In this sub-chapter, I summarize the topics from the benefits of Data. Some of the benefits are improve processes, identify opportunities and trends, launch new products and make thoughtful decisions.
Data Ecosystem is the various elements that interact with one another in order to produce, manage, store, organize, analyze, and share data. Some Roles of this Data Ecosystem are Data Science creating new ways of modeling and understanding the unknown by using raw data (create a new questions) and Data Analyst find answers to existing question by creating insight or the science of data.
Skills need to be Data Analyst
Analytical Skills are qualities and characteristics associated with solving problems using facts. 5 Essential Points are:
- Curiosity
- Understanding Context (context is the condition in which something exists or happens)
- A Technical Mindset is the ability to break things down into smaller steps or pieces and work with them in an orderly and logical way
- Data Design is how you organize information
- Data Strategy the management of the people, processes and tools used in data analysis
Assessing information through an analytical lens
Analytical Thinking is process identifying and defining a problem then solving it by using data in an organized, step-by-step manner. These are 5 components to help analytical thinking:
- visualization = the graphical representation of information
- strategy = stay focus and on track what do we want to achieve from data we collect
- problem-orientation = identify, describe and solve the problem
- correlation = relationship between data. one thing to take a note is correlation does not equal causation
- big-picture and detail-oriented thinking = to see opportunities and figuring out all aspects
Data Lifecycle
- Planning data = identify source of data, who is collecting, storing the data
- Capture data = collecting data
- Manage data = how we clarify our data, data cleansing
- Analyze data = data is used to solve problem, make decision
- Archive data
- Destroy data = to delete any sensitive or private data
Chapter 2 - Asking Effective Questions
learn to ask effective question to lead to insights to solve business problem. The first thing is Structured Thinking. Structured thinking is the process of recognizing the current problem or situation, organizing available information, revealing gaps and opportunities and identifying the options.
6 Basic Problem Types
- Making Predictions. Example: How to determine the best ads method for a target audience
- Categorizing things. Example: How to improve customer satisfaction levels
- Spotting something unusual. Collecting data and analyzing to find unusual data
- Identifying themes. Example: How to improve user experience
- Discovering connections. Example on logistics company: How to reduce waiting time
- Finding patterns. Example: How to Stop machines from breaking down
An Effective questions could follow this Framework.
- Specific questions are simple, significant, and focused on a single topic or a few closely related ideas.
- Measurable questions can be quantified and assessed.
- Action-Oriented questions encourage change.
- Relevant questions matter, are important, and have significance to the problem you're trying to solve.
- Time-bound questions specify the time to be studied.
Data Empowers Decisions
Data analysis can help us make more informed decisions. Data-inspired decision-making explores different data sources to find out what they have in common.
Quantitative and Qualitative Data
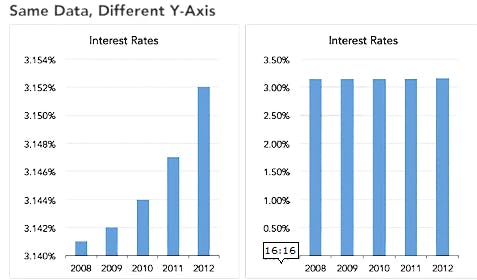
Quantitative data is specific and objective measures of numerical facts. This is about the what, how many, or how often. Sometimes this data is represent with Chart or Graphs. Qualitative data is subjective or explanatory measures of qualities and characteristics. This is about the why.
Sharing Findings with Dashboards and Reports
Report is static collection of data given to stakeholders periodically.
- Pros: High-level historical data, easy to design, pre-cleaned and sorted data
- Cons: Continual maintenance, less visually appealing, static
Dashboard monitors live, incoming data.
- Pros: Dynamic, automatic, and interactive. More stakeholder access and Low maintenance
- Cons: Labor-intensive design, can be confusing, Potentially uncleaned data.
Then, we learn about what Metric is. Metric is single, quantifiable type of data that can be used for measurement. Metric Goal is a measurable goal set by a company and evaluated using metrics.
Data Analytics Using Spreadsheet
Spreadsheet often use to do some tasks like:
- Organize your data. Example: pivot table, sort and filter.
- Calculate your data using Formulas (common formulas: sum, average, min, max)
The Importance of Define the Problem domain correctly and clearly
What is problem domain? Problem domain is the specific area of analysis that encompasses every activity affecting or affected by the problem.
We can use structured approach and critical thinking to solve the problem. Structured thinking is the process of recognizing the current problem or situation, organizing available information, revealing gaps and opportunities, and identifying the options. This structured thinking can be help by make a to do list, create timeline, and checklist for the progress.
Scope of Work (SOW) is an agreed-upon outline of the work you're going to perform on a project. Some points in SOW are Deliverables, Timeline, Milestones, Reports.
How to stay objective as a Data Analyst
Stay objective as a data analyst is about the context. Context is the condition in which something exists or happens. The framework is usually called DIKW (Data, Information, Knowledge, and Wisdom).
How to communicate effectively as a Data Analyst.
We can do fulfill the stakeholders need, build trust, create communication. Before communicate think about: Who your audience is What they already know What they need to know How you can communicate that effectively to them
Always practice to communicate professionally. The important is being clear and concise. Communication strategies flag problems early for stakeholders and set realistic expectations at every stage of the project.
The rest is about how to do an effective meetings.
Chapter 3 - Prepare data for the Exploration
This chapter's goals is: Understanding the different types of data and data structures What type of data is right for the question you're answering Practical skills about how to extract, use, organize and protect your data
Present data compelling and informative
- How data is collected: Interviews, Observations, Forms, Questionnaires, Surveys, Cookies.
- Data collection considerations: How the data will be collected, Choose data sources, Decide what data to use, How much data to collect, Select the right data type, Determine the time frame.
- Discrete data: data that is counted and has a limited number of values.
- Continuous data: data that is measured and can have almost any numeric value.
- Nominal data: A type of qualitative data that is categorized without a set order
- Ordinal data: a type of qualitative data with a set order or scale.
Ensuring Credibility in Your Data
Analyze data for bias and Credibility
- Bias is a preference in favor of or against a person, group of people, or thing.
- Data bias is a type of error that systematically skews results in a certain direction.
- Unbiased sampling is a sample that's representative of the population being measured.
Types of data Bias
- Sampling bias is a sample that isn't representative of the population as a whole.
- Observer bias (experimenter / research bias) is the tendency for different people to observe things differently.
- Interpretation bias is the tendency to always interpret ambiguous situations in a positive or negative way
- Confirmation bias is the tendency to search for or interpret information in a way that confirms pre-existing beliefs
Good Data vs Bad Data
Good data is follow these:
- Reliable
- Original
- Comprehensive
- Current
- Cited
Bad data is not reliable. Example:
Data Ethics, Privacy and Access
Data Ethics well-founded standards of right and wrong that dictate how data is collected, shared, and used. Aspects of data ethics: Ownership: Individuals own the raw data they provide and they have primary control over its usage, how it's processed and how it's shared Transaction transparency is all data-processing activities and algorithms should be completely explainable and understood by the individual who provides their data. This to avoid bias data. Consent is an individual's right to know explicit details about how and why their data will be used before agreeing to provide it. Currency is Individuals should be aware of financial transactions resulting from the use of their personal data and the scale of these transactions.
Privacy is preserving a data subject's information and activity any time a data transaction occurs.
Accessibility to access data is about interoperability is key to open data's success. Openness (or open data) free access, usage, and sharing of data
Database and Metadata
This sub-topic discuss about the terms of Database and Metadata.
Database is a collection of data stored in a computer system. Relational database is a database that contains a series of tables that can be connected to form relationships. This database could include Primary and Foreign key. Schema is a way of describing how something is organized.
Metadata is used in database management to help data analysts interpret the contents of the data within the database. Type of Metadata:
- Descriptive metadata
- Structural metadata
- Administrative metadata
Benefits of metadata:
- Metadata creates a single source of truth by keeping things consistent and uniform.
- Metadata also makes data more reliable by making sure it's accurate, precise, relevant and timely.
Metadata repositories is about description of the state, location, the structures and flows and keep track of who accesses and when. Metadata management is about where do you stored this metadata in a single location and standardized. Data governance is a process to ensure the formal management of a company's data assets.
Best Practices when organizing data
- Naming conventions
- Foldering
- Archiving older files
- Align your naming and storage practices with your team
- Develop metadata practices
Create Your Data Analyst Online Presence
The last topic of this chapter is about how to strengthen your online presence as a data analyst. The importance of online presence:
- Help potential employers find you
- Make connections with other analysts
- Learn and share data findings
- Participate in community events